Wednesday 10 January 2018

Software Analysis & Design Tools 2

HIPO Diagram

HIPO (Hierarchical Input Process Output) diagram is a combination of two organized method to analyze the system and provide the means of documentation. HIPO model was developed by IBM in year 1970.
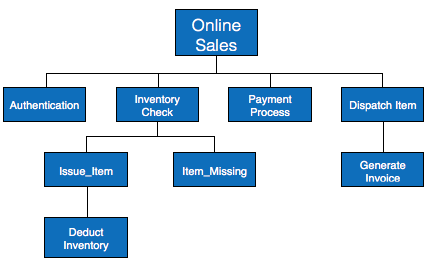
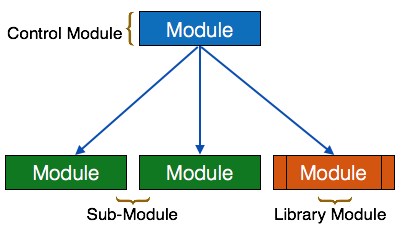
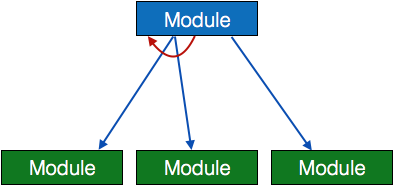
HIPO diagram represents the hierarchy of modules in the software system. Analyst uses HIPO diagram in order to obtain high-level view of system functions. It decomposes functions into sub-functions in a hierarchical manner. It depicts the functions performed by system.
HIPO diagrams are good for documentation purpose. Their graphical representation makes it easier for designers and managers to get the pictorial idea of the system structure.
HIPO diagrams
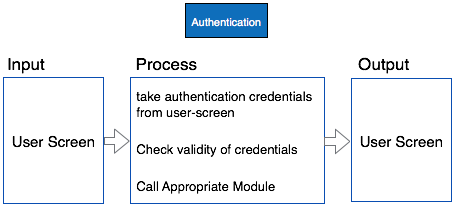
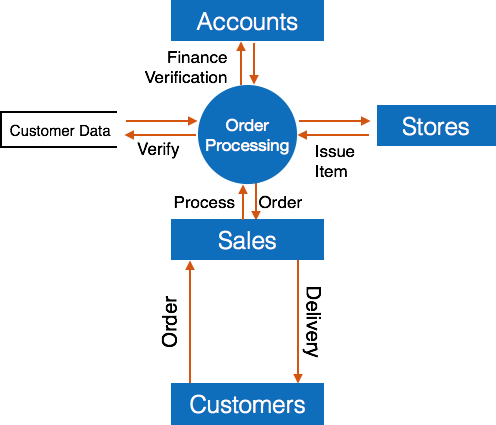
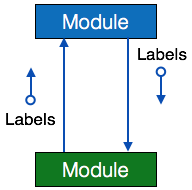
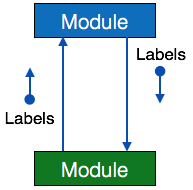
In contrast to IPO (Input Process Output) diagram, which depicts the flow of control and data in a module, HIPO does not provide any information about data flow or control flow.
IPO Chart

Example

Both parts of HIPO diagram, Hierarchical presentation and IPO Chart are used for structure design of software program as well as documentation of the same.

Structured English

Most programmers are unaware of the large picture of software so they only rely on what their managers tell them to do. It is the responsibility of higher software management to provide accurate information to the programmers to develop accurate yet fast code.
Other forms of methods, which use graphs or diagrams, may are sometimes interpreted differently by different people.
Hence, analysts and designers of the software come up with tools such as Structured English. It is nothing but the description of what is required to code and how to code it. Structured English helps the programmer to write error-free code.
Other form of methods, which use graphs or diagrams, may are sometimes interpreted differently by different people. Here, both Structured English and Pseudo-Code tries to mitigate that understanding gap.
Structured English is the It uses plain English words in structured programming paradigm. It is not the ultimate code but a kind of description what is required to code and how to code it. The following are some tokens of structured programming.
IF-THEN-ELSE,  
DO-WHILE-UNTIL
Analyst uses the same variable and data name, which are stored in Data Dictionary, making it much simpler to write and understand the code.

Example

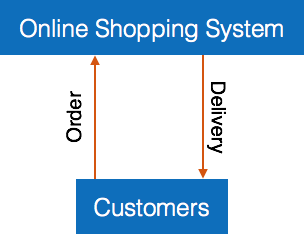
We take the same example of Customer Authentication in the online shopping environment. This procedure to authenticate customer can be written in Structured English as:
Enter Customer_Name
SEEK Customer_Name in Customer_Name_DB file
IF Customer_Name found THEN
   Call procedure USER_PASSWORD_AUTHENTICATE()
ELSE
   PRINT error message
   Call procedure NEW_CUSTOMER_REQUEST()
ENDIF
The code written in Structured English is more like day-to-day spoken English. It can not be implemented directly as a code of software. Structured English is independent of programming language.

Pseudo-Code

Pseudo code is written more close to programming language. It may be considered as augmented programming language, full of comments and descriptions.
Pseudo code avoids variable declaration but they are written using some actual programming language’s constructs, like C, Fortran, Pascal etc.
Pseudo code contains more programming details than Structured English. It provides a method to perform the task, as if a computer is executing the code.

Example

Program to print Fibonacci up to n numbers.
void function Fibonacci
Get value of n;
Set value of a to 1;
Set value of b to 1;
Initialize I to 0
for (i=0; i< n; i++)
{
   if a greater than b 
   {
      Increase b by a;
      Print b;
   } 
   else if b greater than a
   {
      increase a by b;
      print a;
   }
}

Software Analysis & Design Tools

Software analysis and design includes all activities, which help the transformation of requirement specification into implementation. Requirement specifications specify all functional and non-functional expectations from the software. These requirement specifications come in the shape of human readable and understandable documents, to which a computer has nothing to do.
Software analysis and design is the intermediate stage, which helps human-readable requirements to be transformed into actual code.
Let us see few analysis and design tools used by software designers:

Data Flow Diagram

Data flow diagram is graphical representation of flow of data in an information system. It is capable of depicting incoming data flow, outgoing data flow and stored data. The DFD does not mention anything about how data flows through the system.
There is a prominent difference between DFD and Flowchart. The flowchart depicts flow of control in program modules. DFDs depict flow of data in the system at various levels. DFD does not contain any control or branch elements.

Types of DFD

Data Flow Diagrams are either Logical or Physical.
  • Logical DFD - This type of DFD concentrates on the system process, and flow of data in the system.For example in a Banking software system, how data is moved between different entities.
  • Physical DFD - This type of DFD shows how the data flow is actually implemented in the system. It is more specific and close to the implementation.

DFD Components

DFD can represent Source, destination, storage and flow of data using the following set of components -
DFD Components
  • Entities - Entities are source and destination of information data. Entities are represented by a rectangles with their respective names.
  • Process - Activities and action taken on the data are represented by Circle or Round-edged rectangles.
  • Data Storage - There are two variants of data storage - it can either be represented as a rectangle with absence of both smaller sides or as an open-sided rectangle with only one side missing.
  • Data Flow - Movement of data is shown by pointed arrows. Data movement is shown from the base of arrow as its source towards head of the arrow as destination.

Levels of DFD

  • Level 0 - Highest abstraction level DFD is known as Level 0 DFD, which depicts the entire information system as one diagram concealing all the underlying details. Level 0 DFDs are also known as context level DFDs.
  • Level 0
  • Level 1 - The Level 0 DFD is broken down into more specific, Level 1 DFD. Level 1 DFD depicts basic modules in the system and flow of data among various modules. Level 1 DFD also mentions basic processes and sources of information.
  • Level 1
  • Level 2 - At this level, DFD shows how data flows inside the modules mentioned in Level 1.
    Higher level DFDs can be transformed into more specific lower level DFDs with deeper level of understanding unless the desired level of specification is achieved.

Structure Charts

Structure chart is a chart derived from Data Flow Diagram. It represents the system in more detail than DFD. It breaks down the entire system into lowest functional modules, describes functions and sub-functions of each module of the system to a greater detail than DFD.
Structure chart represents hierarchical structure of modules. At each layer a specific task is performed.
Here are the symbols used in construction of structure charts -
  • Module - It represents process or subroutine or task. A control module branches to more than one sub-module. Library Modules are re-usable and invokable from any module.SC Modules
  • Condition - It is represented by small diamond at the base of module. It depicts that control module can select any of sub-routine based on some condition.SC Condition
  • Jump - An arrow is shown pointing inside the module to depict that the control will jump in the middle of the sub-module.SC Module Jump
  • Loop - A curved arrow represents loop in the module. All sub-modules covered by loop repeat execution of module.SC Loop
  • Data flow - A directed arrow with empty circle at the end represents data flow.SC Dataflow
  • Control flow - A directed arrow with filled circle at the end represents control flow.
  • SC ControlFlownext part will be post in next up date which will be update really soon

Data Types in C++

Data types define the type of data a variable can hold, for example an integer variable can hold integer data, a character type variable can hold character data etc.
Data types in C++ are categorised in three groups: Built-inuser-defined and Derived.


Built in data types


char: For characters. Size 1 byte.
char ch = 'A';
int: For integers. Size 2 bytes.
int num = 100;
float: For single precision floating point. Size 4 bytes.
float num = 123.78987;
double: For double precision floating point. Size 8 bytes.
double num = 10098.98899;
bool: For booleans, true or false.
bool b = true;
wchar_t: Wide Character. This should be avoided because its size is implementation defined and not reliable.


User-defined data types

We have three types of user-defined data types in C++
1. struct
2. union
3. enum
I have covered them in detail in separate tutorials. For now just remember that these comes under user-defined data types.

Derived data types in C++

We have three types of derived-defined data types in C++
1. Array
2. Function
3. Pointer
They are wide topics of C++ and I have covered them in separate tutorials. Just follow the tutorials in given sequence and you would be fine.


Featured Post

All Answers of Quiz regarding to this course on Fiverr "Online Freelancing Essentials: Be A Successful Fiverr Seller"

To Clear All quiz of mentioned Course you can have a look on or check questions answers as well. Course name:  Online Freelancing Essentials...

Popular Posts